Winter Outlook 2020-2021

Welp….it’s that time of year again…..time to share some thoughts on what I think the winter pattern might look like.
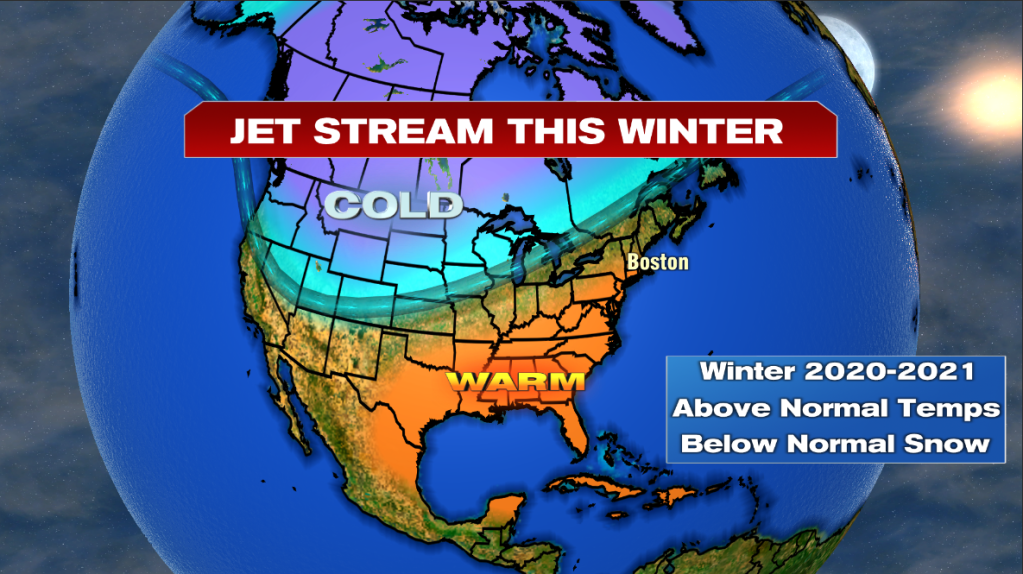
General thoughts on our winter pattern
- Overall, mild temps expected….potential for stretches of significant warmth
- Below normal snowfall (but more than what we had last winter. I think.)
- “Messy Mix” type storms with storm track well inland this winter
Analog Forecasting…Looking to the past to predict the future
As always….I start with the state of the Pacific Ocean temps. The oceans do indeed link up with the atmosphere and can have an effect on the global circulation/weather patterns.
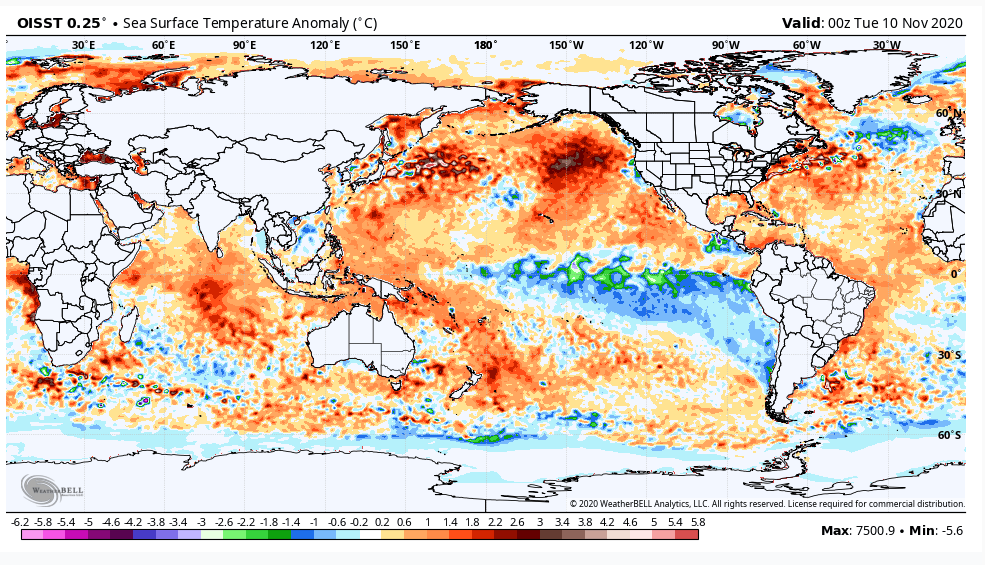
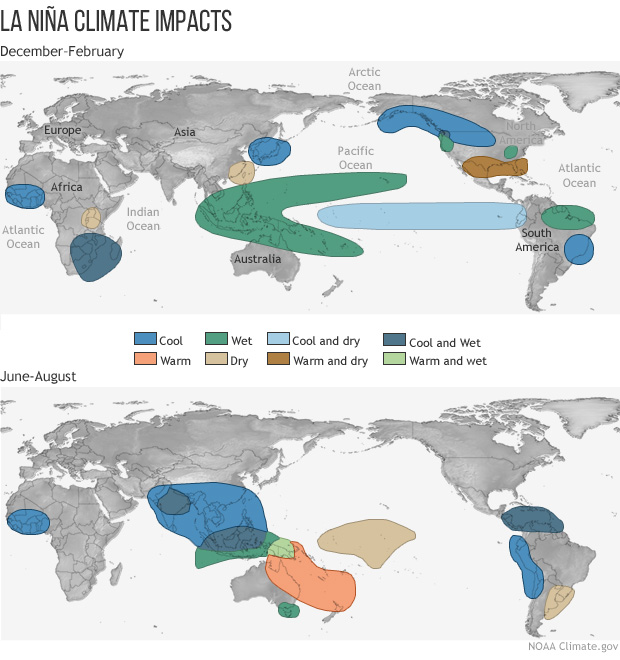
As you can see…a lot of warm colors….the oceans are indeed warm compared to 30-50 years ago but even with the background state of climate change doing its thing, there is a large patch of blue centered near the equatorial Pacific…cooler than normal water temperatures. That is a signal for La Nina! Here is how a La Nina can affect global temperature and precipitation patterns during the months of December-January-February (DJF):
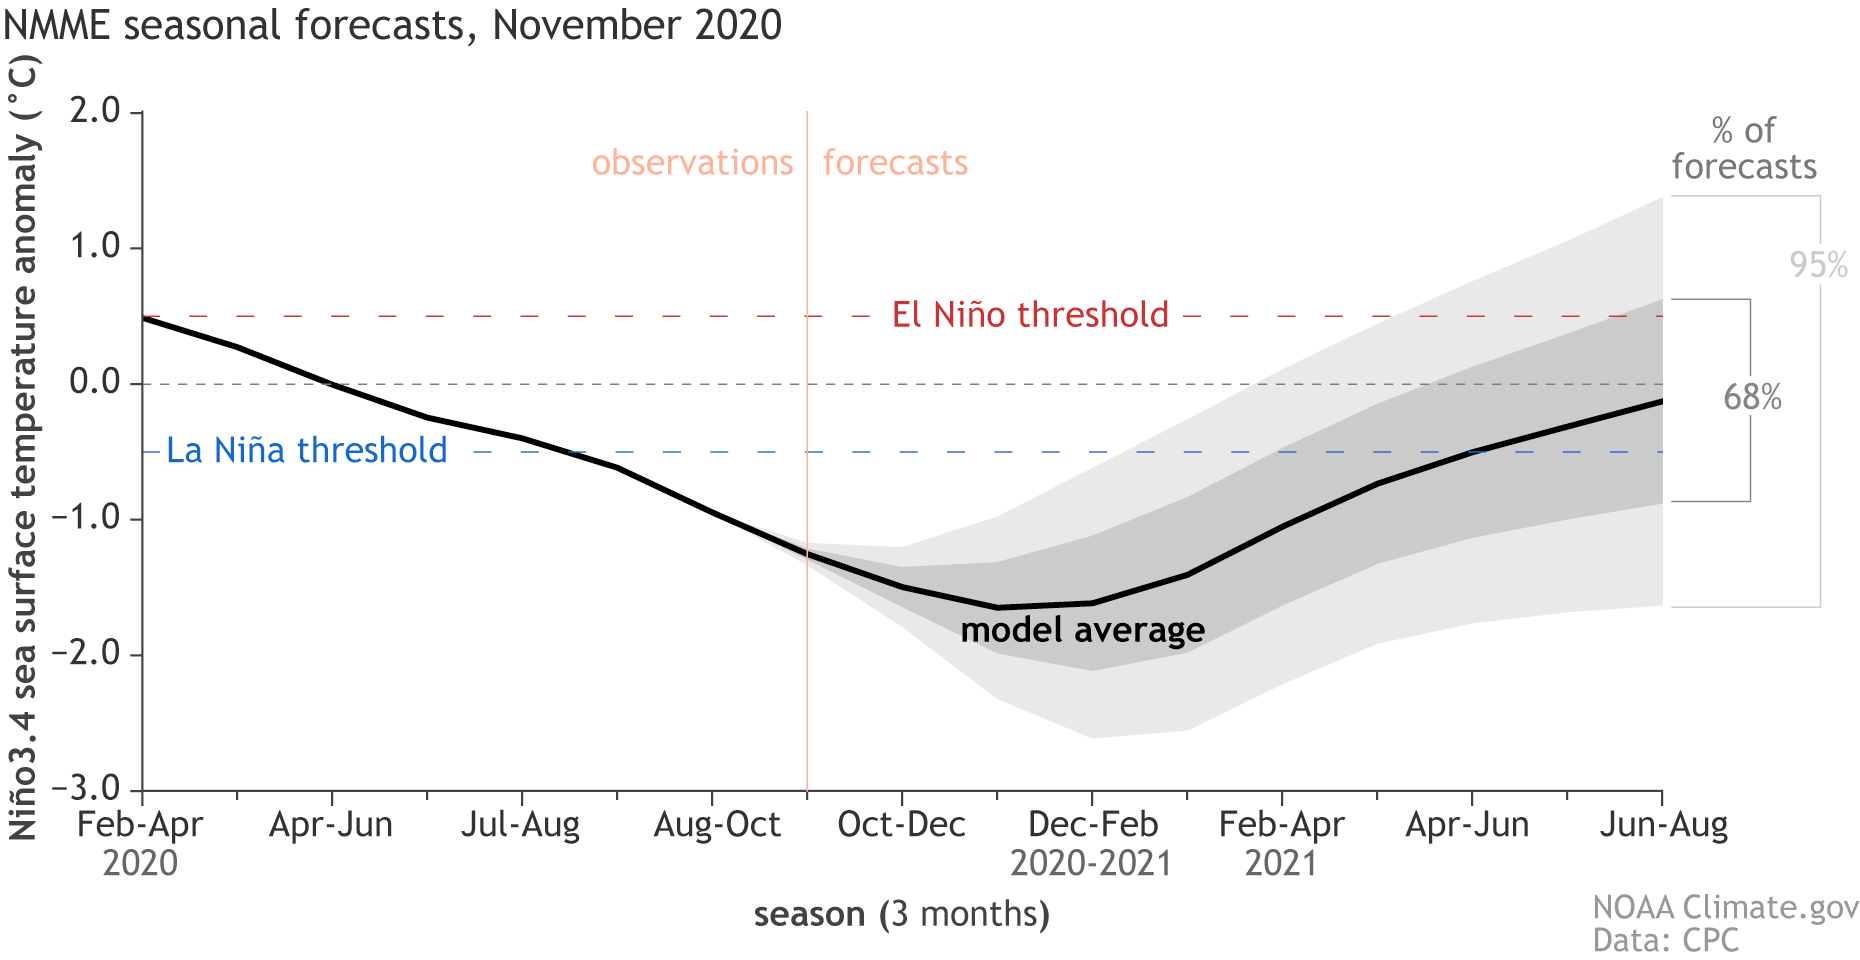
Now…..La Nina’s are like Snowflakes…no two are alike. They are typically broken up into 3 categories….Weak, Moderate and Strong. As of this blog post (November 19th), the La Nina is high end Moderate (borderline strong). What about over the next 2-3 months? When we look at the North American Multi Model Ensemble system (NMME) we see a borderline Moderate-Strong La Nina:
OK, so we’re thinking moderate-strong La Nina versus a weak La Nina…..any difference between the two with regard to seasonal snowfall? Yes there is! Check out this map of North America snowfall Anomaly during a Weak La Nina:
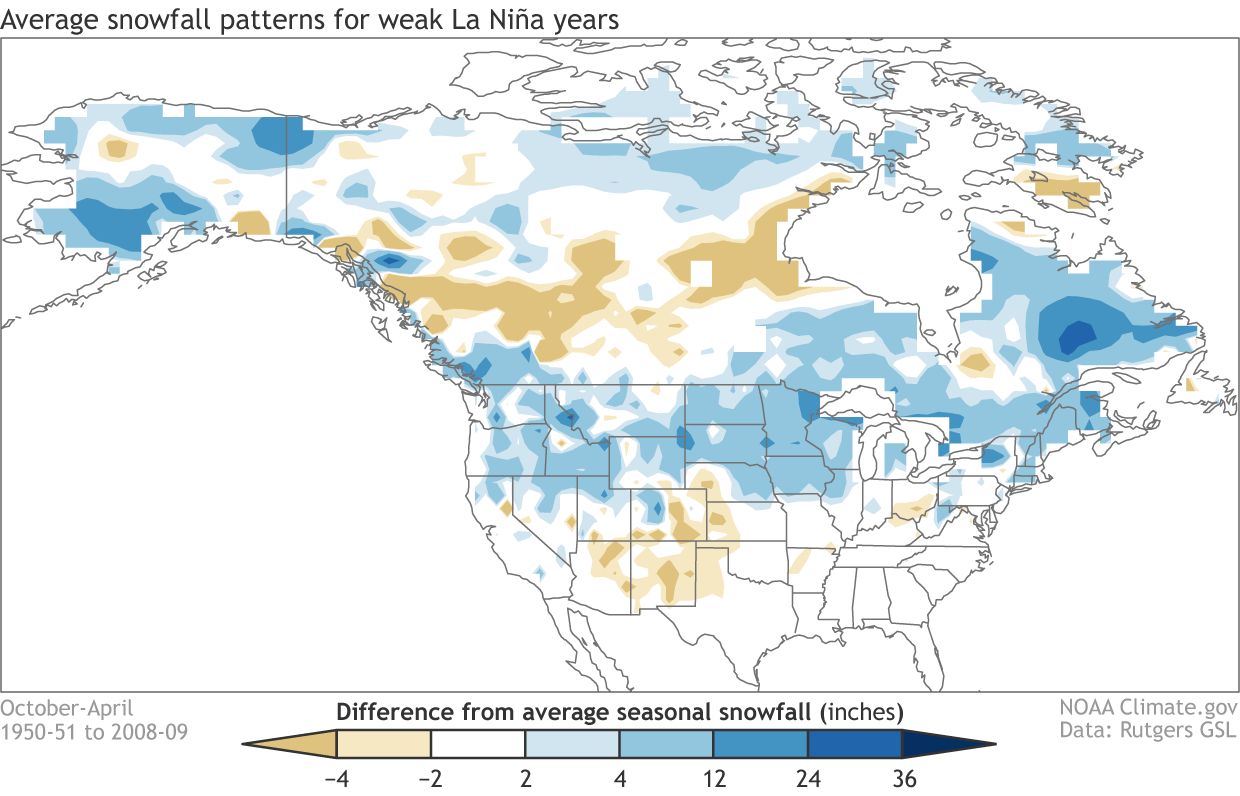
Don’t take the contouring literal as there are some limitations with contouring the data but there is a rather large area of blue shading across the northern tier of the United States including New England…above normal snowfall. Now take a look at how a Strong La Nina affects seasonal snowfall:
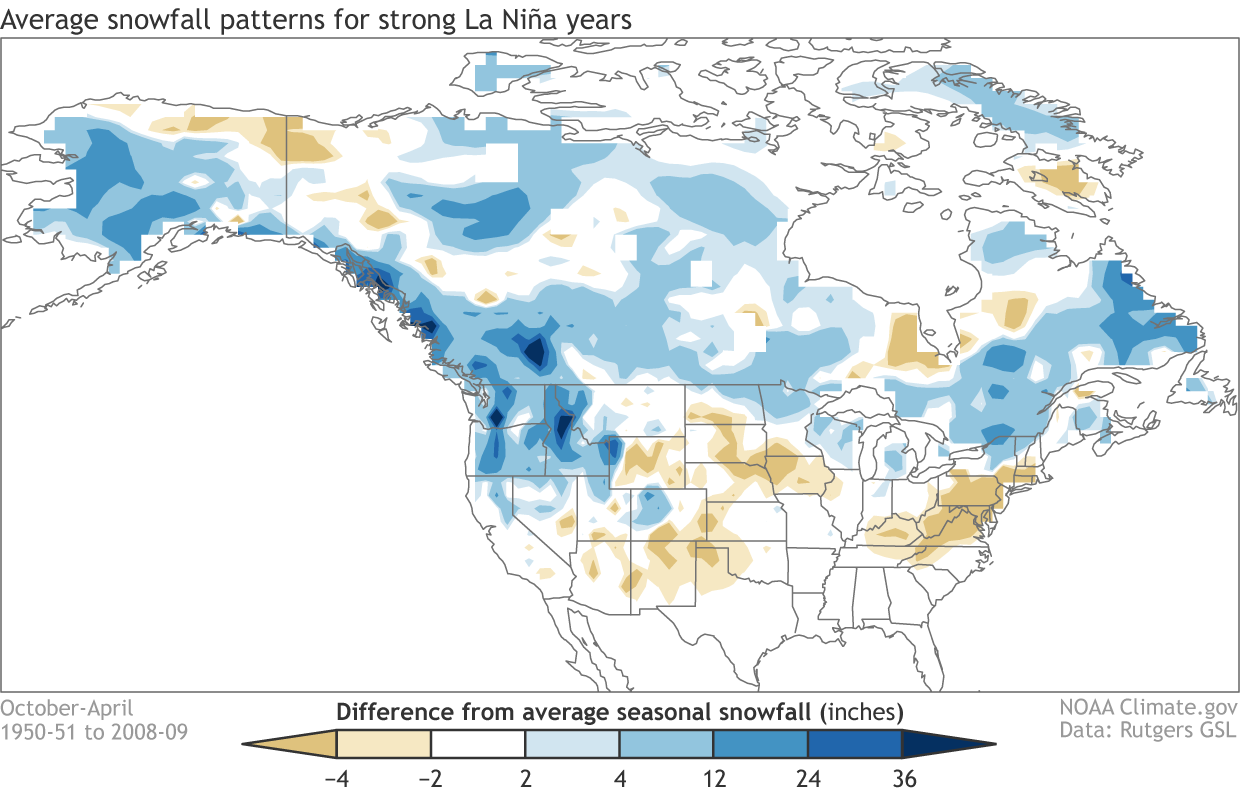
Focus on southern New England…..instead of the blue shading, brown….below normal snowfall. Also note the blue shading across northern New York and northern New England…..La Nina (regardless of strength) typically means above normal snowfall for those areas.
To compile my winter snowfall forecast, I wanted to look for past Strong La Nina’s over the past 30 years or so (since the late 1980s). I also wanted to look at past hyper-active hurricane years (which usually occur during La Nina years) and see what New England winters were like after those hyper-active hurricane years.
(2020 Hurricane Summary…Still in progress…30 Named Storms)
When I use both of those parameters I come up with the following Winters:
2011-12
2010-11
2007-08
1998-99
1988-89
All Moderate-Strong La Nina’s.
So here is how those following winters ended up in regards to temperature and snowfall (for both Boston & Worcester):
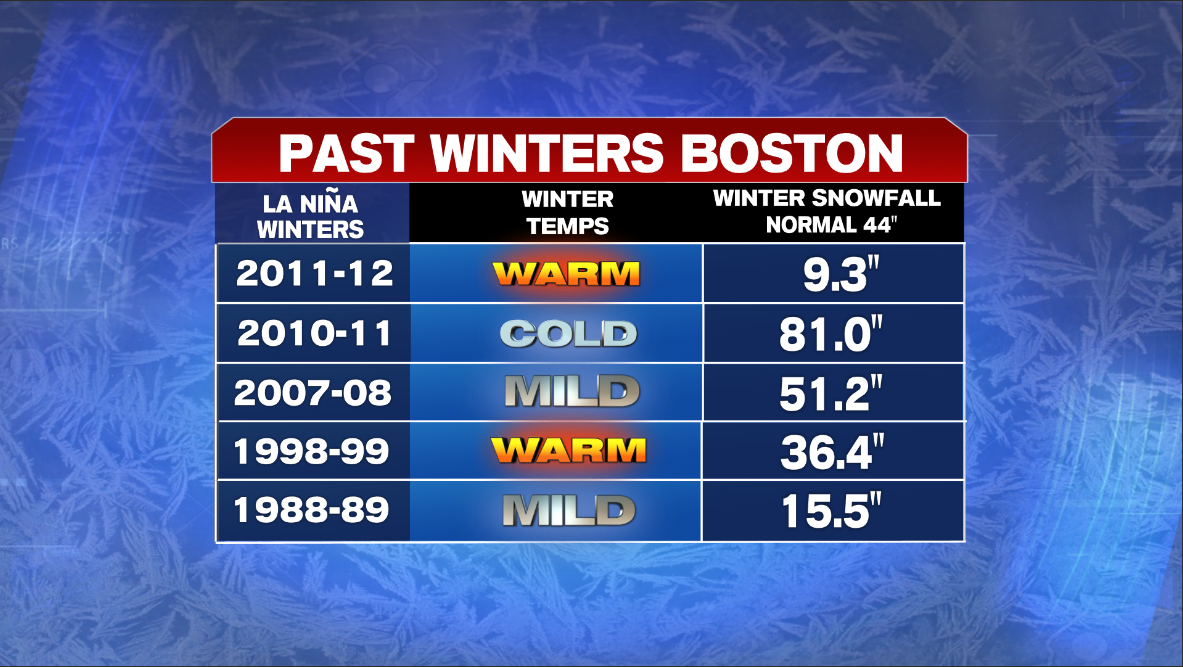
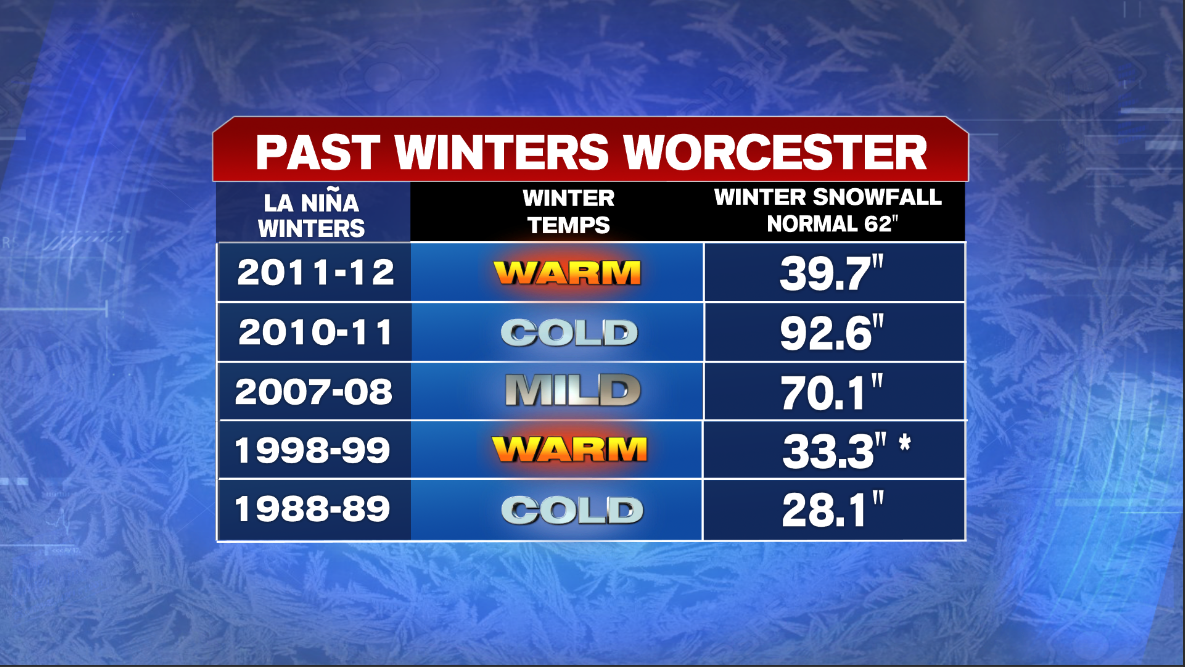
Some Takeaways from those lists…..
- The sample size is small but those are most recent strong La Nina winters New England has seen.
- A quick glance would suggest below normal snowfall and above normal temps
- There is the one winter that goes against the others…….Winter of 2010-11.
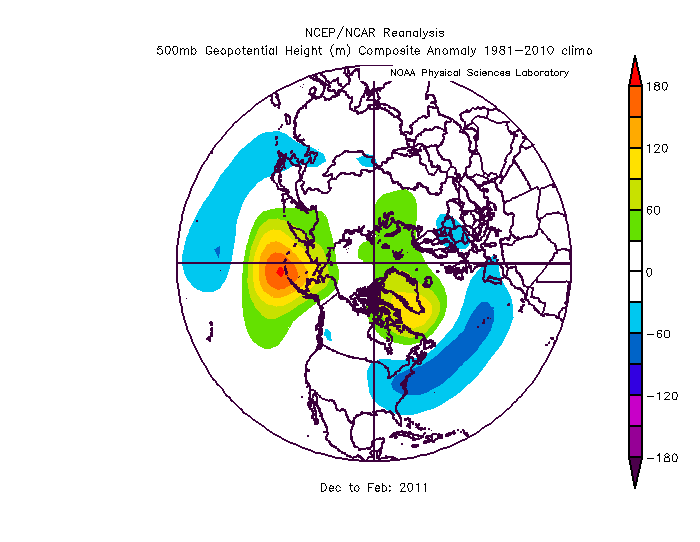
That winter featured some incredible High Latitude Blocking (the warm colors near Greenland as well as the Aleutian Islands). That high latitude (Greenland) blocking led to a very active and cold storm track for the New England for much of the winter. Boston received 60” of snow in December-January! As of this writing, I do not see that type of blocking (persistent and strong) occurring this winter but….it IS possible that we get some blocking to occur mid-late winter which could provide stretches of cold & snow.
Computer Models
This year….I took a good hard look at them along with the analogs (past winter patterns). Here is what the models are saying:
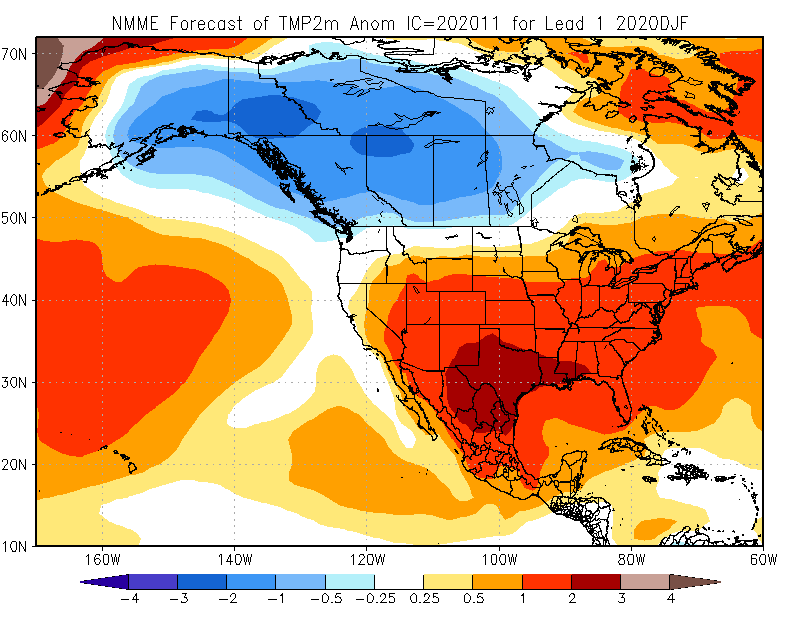
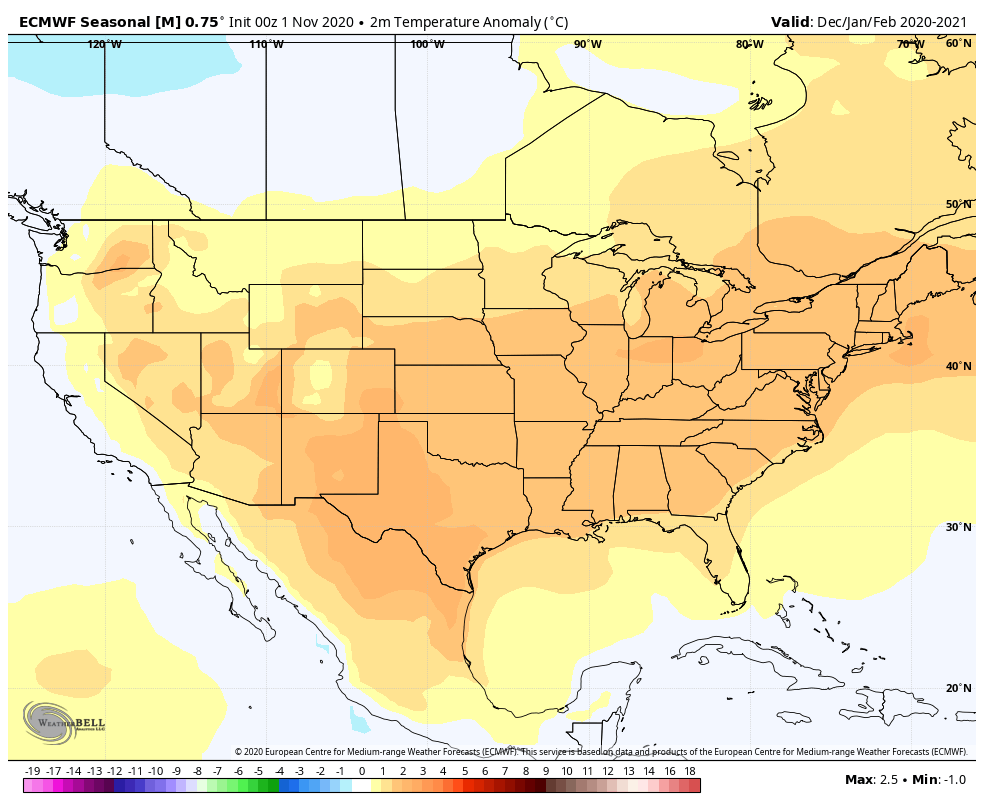
Not a lot of cold on those maps for southern New England. Now…it’s still winter, so we’re not saying plan on 3 months of September weather but rather, the warm days will likely out-number the cold days during the winter months of December-January-February (IE in that warm winter of 2011-2012…of the 91 days from December 1-February 29, 70 days featured above normal temps!)
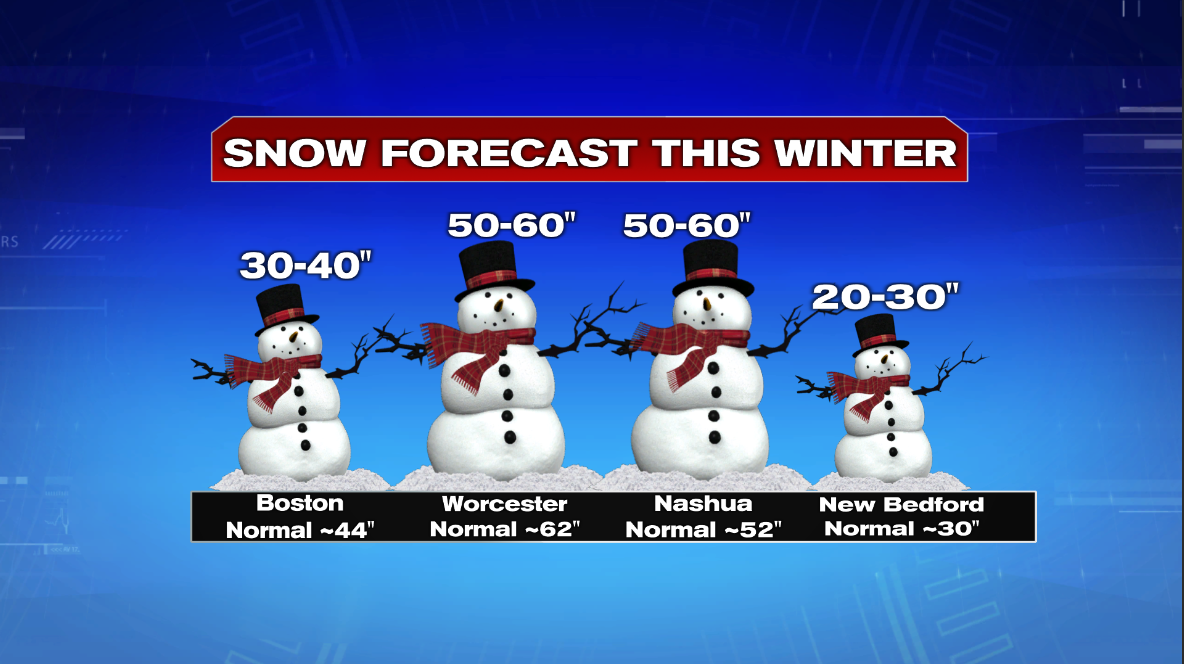
As for snowfall, I doubt we have as little as last winter (16” for Boston…remember we’ve already logged 4.3” from October 30th) but I am forecasting below normal for much of southern New England:
So there you have it! Likely a winter with limited cold and snow….but time will tell. Be safe!

~JR